Developing a D3.js Edge
10. Adding Brushing
- Examine the concept of brushing
- Incorporate brushing into our application
![]() The source code and data files are available in the
The source code and data files are available in the code/Chapter10/ directory tree.
Incorporating Brushing into our App
Brushing allows us to interact with our maps by selecting an area on the map, and translating that area to geographic coordinates. This interaction is a key to exploratory data analytics, and will really add a nice touch to each one of our maps by providing a dynamic experience to the user. We will use brushing to select an area on our map, and use our filterLocation method to filter our stop data based on this area. Later on, we will use these filtered locations to inspect the data associated with stop we have selected. the To accomplish this, we will need to modify our map module.
The brush generator in d3.js requires an x and y scale. For our application, these are longitude and latitude respectively. Let's take a look at getting this setup. Our projection generator that we defined earlier scales, centers, and translates our projection within our specified dimensions. For our brush we need to reverse this and get the longitude and latitude coordinate of our specified dimensions so that we can create a scale for both the x and y of the brush generator. Fortunately, d3.js makes this very easy by providing us with an invert method for our projection generator. This method takes an array of pixel coordinates as its argument and returns the longitude and latitude of that point. We can use this method to obtain the minimum and maximum longitude of the x dimension and the minimum and maximum of the y dimension. We will define this in the exports function of our map module. Let us see how this will work:
001:function exports(_selection) {
002:    // Set svg equal to the selection that invokes this module.
003:    svg = svg || _selection;
004:    // Bind an empty datum to the selection. Useful later for zooming.
005:    svg.datum([]);
006:    // Set the projection up using our scale, center, and size parameters.
007:    projection = projection || d3.geo.mercator()
008:    .scale(scale)
009:    .center(center)
010:    .translate([size[0]/2, size[1]/2]);
011:    // Set the path up using our projection definied above.
012:    path = path || d3.geo.path()
013:    .projection(projection);
014:    // Get the longitude of the top left corner of our map area.
015:    long1 = projection.invert([0, 0])[0];
016:    // Get the longitude of the top right corner of our map area.
017:    long2 = projection.invert([width, 0])[0];
018:    // Get the latitude of the top left corner of our map area.
019:    lat1 = projection.invert([0, 0])[1];
020:    // Get the latitude of the bottom left corner of our map area.
021:    lat2 = projection.invert([0, height])[1];
022:}
Now, we have the longitude and latitude of the extents of our map. We can use these to create linear scales that can be used for the x, and y scales of our brush. To do this, we will use the d3.js linear scale generator, using the size of our map as the range, and our computed longitudes and latitudes as the domain.
001://Create a linear scale generator for the x of our brush.
002:brushX = d3.scale.linear()
003:  .range([0, size[0]])
004:  .domain([long1,long2]);
005:
006://Create a linear scale generator for the y of our brush.
007:brushY = d3.scale.linear()
008:  .range([0, size[1]])
009:  .domain([lat1, lat2]);
We now have an x and a y scale that we can use to create our brush. Creating the brush is rather simple:
001://Create our brush using our brushX and brushY scales.
002:brush = d3.svg.brush()
003:  .x(brushX)
004:  .y(brushY)
005:  .on('brush', function () {dispatch.brushing(brush);});
The Created Brush
Putting it all together, we end up with the following:
001://Create and exports function that can be invoked on a selection.
002:function exports(_selection) {
003:
004:    //Set svg equal to the selection that invokes this module.
005:    svg = svg || _selection;
006:
007:    //Bind an empty datum to the selection. Useful later for zooming.
008:    svg.datum([]);
009:
010:    //Set the projection up using our scale, center, and size parameters.
011:    projection = projection || d3.geo.mercator()
012:      .scale(scale)
013:      .center(center)
014:      .translate([size[0]/2, size[1]/2]);
015:
016:    //Set the path up using our projection defined above.
017:    path = path || d3.geo.path()
018:      .projection(projection);
019:
020:    //Get the longitude of the top left corner of our map area.
021:    long1 = projection.invert([0,0])[0];
022:    //Get the longitude of the top right corner of our map area.
023:    long2 = projection.invert([width, 0])[0];
024:
025:    //Get the latitude of the top left corner of our map area.
026:    lat1 = projection.invert([0,0])[1];
027:    //Get the latitude of the bottom left corner of our map area.
028:    lat2 = projection.invert([width, height])[1];
029:
030:    //Create a linear scale generator for the x of our brush.
031:    brushX = d3.scale.linear()
032:      .range([0, size[0]])
033:      .domain([long1,long2]);
034:
035:    //Create a linear scale generator for the y of our brush.
036:    brushY = d3.scale.linear()
037:      .range([0, size[1]])
038:      .domain([lat1, lat2]);
039:
040:    //Create our brush using our brushX and brushY scales.
041:    brush = d3.svg.brush()
042:      .x(brushX)
043:      .y(brushY)
044:      .on('brush', function () {dispatch.brushing(brush);});
045:
046:}
In this method we have created the brush using our brushX and brushY as the x and y scales. In addition we have dispatched a custom event called brushing and passed in the brush so that we may access it on our map module. We will use this to get the extents of our brush and pass them into the filter function we defined earlier. All that remains to create the brush is to create a method that will append to our svg element:
001://Create our addBrush method.
002:exports.addBrush = function () {
003:    svg.append('g')
004:    .attr('class', 'brush')
005:    .call(brush)
006:    .selectAll('rect')
007:    .attr('width', width);
008:    return this;
009:};
Now we can invoke this method on our map module for Zurich and inspect the extent of our brush by listening to the custom brushing event we defined earlier:
001:zurichMap.addBrush()
002:.on('brushing', function (brush) {
003:    console.log(brush.extent());
004:});
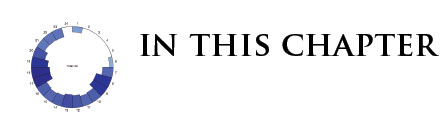
If we navigate to our application in the browser, when we hover over the map of Zurich, we will see crosshairs indicating that we can brush over the area. Brushing over the map will create a black area over the map like this:
The Created Brush
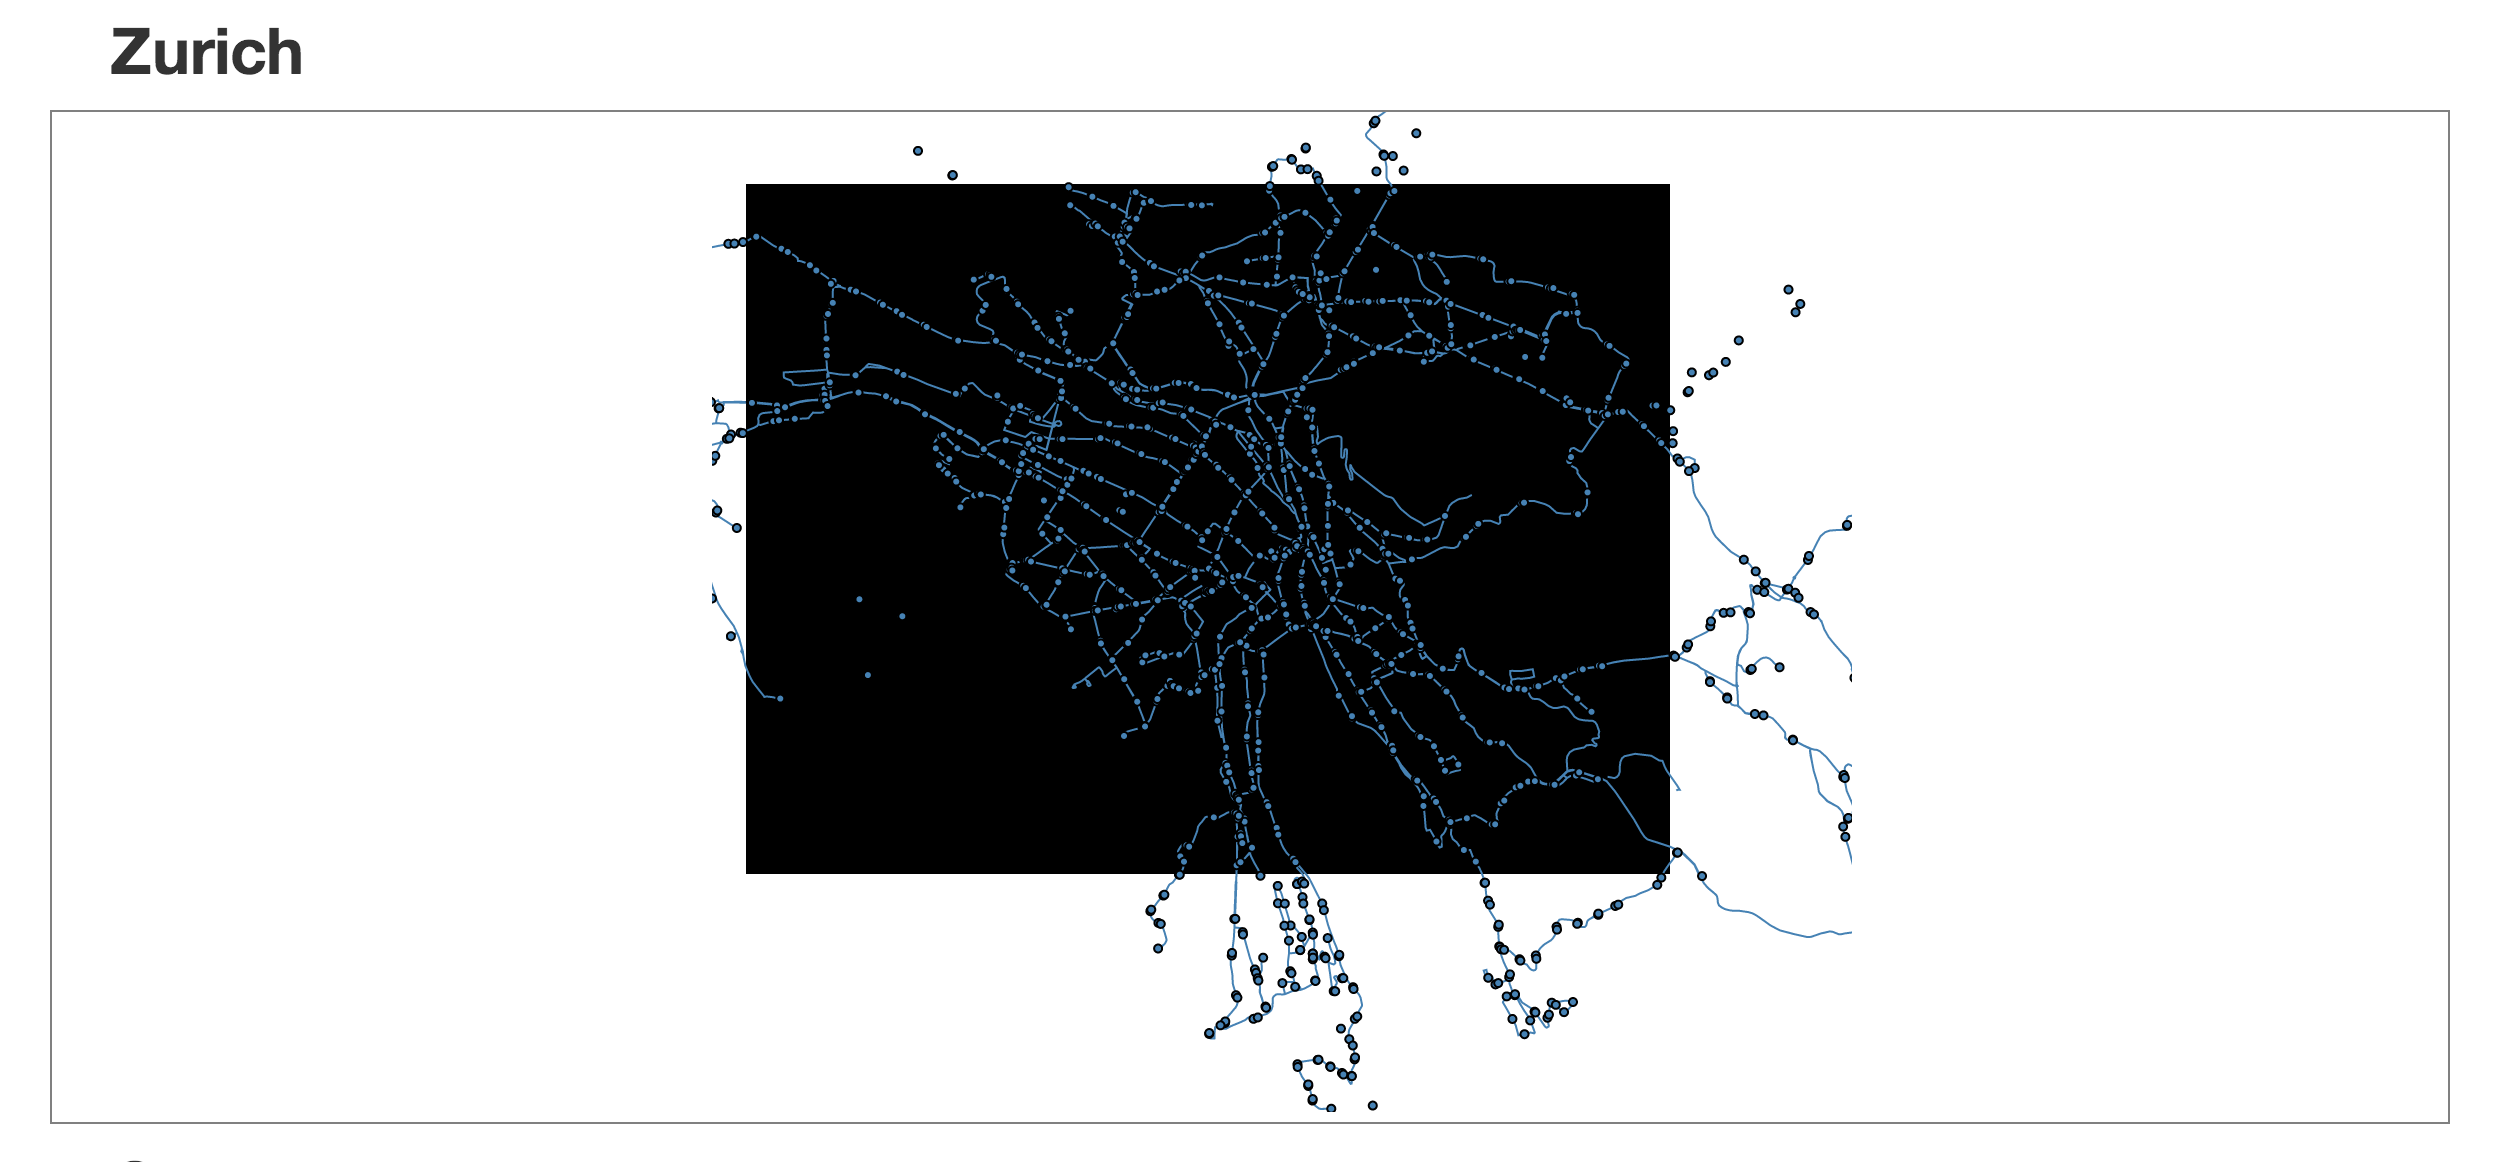
Let's add some styling to make this look a little better:
001:.brush .extent {
002:    stroke: #f09f8c;
003:    fill-opacity: .125;
004:    shape-rendering: crispEdges;
005:}
Now when we brush over the map of Zurich, we will get a nicely formatted box like this:
If we inspect the console of our browser, we will see an array every time the brush changes. This array contains two more arrays, one for the top left corner of our brushed area and one for the bottom right of our brushed area. Each one of these arrays contains the longitude and latitude of these respective points:
001:[ [ 8.468999999999998, 47.40062403830741 ], [ 8.468999999999998, 47.40062403830741 ] ]
Summary
This is the same structure that we passed into our filterLocation method on our data manager to return all of the stops within the area. This is what we will use to link our two visualizations together as it will allow us to filter the stop data that we will use for our radial histogram simply by brushing over an area of the map. We will develop our radial histogram in Chapter 12 but first, in the next chapter, we need to attend to integrating Crossfilter properly into the application.