Developing a D3.js Edge
4. Reusable Bar Chart
- Examples of reusable bar charts using the reusable plugin API
- A discussion of the
customHoverevent and generation of axis - Explore binding data to the bar charts
- Cover flexible methods of creating the charts
So far we've discussed the plugin API and we've shown a basic "Hello World" example of a module. In this chapter we take an enhanced version of the bar chart that we showed in Chapter 1 ("Standard D3") and illustrate how we can re-write this using the plugin API.
At the end of this chapter we list how you can quickly amend this sample code to have three separate instances of the bar chart module all on the same page.
We also provide a walkthrough of the "Bar Chart with Axes" example to illustrate how to create a bar chart plugin.
![]() Access the source code:
Access the source code: code/Chapter04/ReusableWithAxes/
Description of The "Reusable Bar Chart with Axes" Example
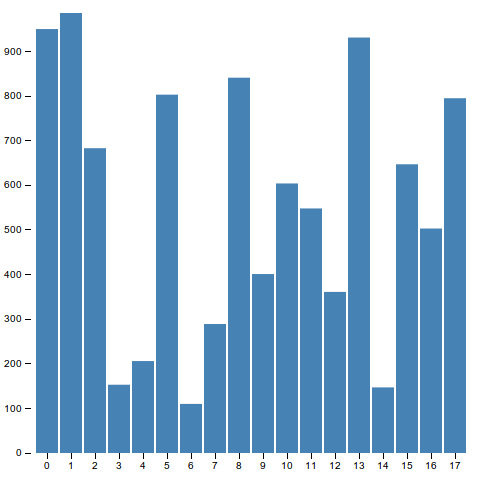
If you run the example code in code/Chapter04/ResuableWithAxes/, you should see the following (or something like the following), which should randomly change every few seconds:
Before diving into the actual code, let's clarify what's going on in terms of SVG elements:
- One
<svg>element per chart that contains the following code. - One SVG
<g>element that contains the chart. - One SVG
<g>element for each of the bars, the x-axis and the y-axis. <g>elements for each entry on the x and y axis.
This structure is created below. Rather than manually recreate this structure for each instance of our chart, we can let our resuable pattern take care of that for us! Let's walkthrough the code to make this happen.
001:// Main SVG element. One per instance of the chart module:
002:<svg class="chart" height="500" width="500">
003:// Main containing SVG 'g' element
004:<g class="container-group">
005:  // SVG 'g' element to contain the actual bar's of the bar chart.
006:  <g class="chart-group">
007:    <rect class="bar" x="9" width="8" etc. ...
008:    <rect class="bar" x="18" width="8" etc. ...
009:  </g>
010:
011:  // SVG 'g' to contain the x-axis
012:  <g class="x-axis-group axis">
013:    <g style="opacity: 1;" transform="translate(13,0)">
014:      <line class="tick" y2="6" x2="0"></line>
015:      <text y="9" dy=".71em" style="text-anchor: middle;" x="0">0</text>
016:    </g>
017:    <g style="opacity: 1;" transform="translate(22,0)">
018:      <line class="tick" y2="6" x2="0"></line>
019:      <text y="9" dy=".71em" style="text-anchor: middle;" x="0">1</text>
020:    </g>
021:  </g>
022:
023:  // SVG 'g' to contain the y-axis
024:  <g class="y-axis-group axis">
025:    <g style="opacity: 1;">
026:      <line class="tick" x2="-6" y2="0"></line>
027:      <text x="-9" dy=".32em" style="text-anchor: end;" y="0">0</text>
028:    </g>
029:    <g style="opacity: 1;" transform="translate(0,394.8254699707031)">
030:      <line class="tick" x2="-6" y2="0"></line>
031:      <text x="-9" dy=".32em" style="text-anchor: end;" y="0">100</text>
032:    </g>
033:  </g>
034:</g>
035:</svg>
Code Walkthrough
Soon we will outline the main differences between this example code, and that outlined in the "Hello World" example in the previous chapter.
First up though, just like all the previous examples, let's setup our module in its own namespace:
001:// Setup our barchart in the d3.custom namespace.
002:d3.custom = {};
Start the definition of the module, declare a set of private variables, and declare the dispatcher function for the custom customHover event:
001:d3.custom.barChart = function module() {
002:    // Various internal, private variables of the module.
003:    var margin = {top: 20, right: 20, bottom: 40, left: 40},
004:        width = 500,
005:        height = 500,
006:        gap = 0,
007:        ease = 'bounce'; // Use the 'bounce' transition type.
008:    var svg;
009:
010:    // Dispatcher for the 'customHover' event
011:    var dispatch = d3.dispatch('customHover');
Next, move onto the start of the main internal functionality of the module, and begin by defining the visible width and height of the chart:
001:// Main internal module functionality:
002:function exports(_selection) {
003:    _selection.each(function(_data) {
004:        var chartW = width - margin.left - margin.right,
005:            chartH = height - margin.top - margin.bottom;
Here the code defines various functions and components to be used to draw the x and y axis:
001:// x and y axis variables and functions
002:var x1 = d3.scale.ordinal()
003:    .domain(_data.map(function(d, i) { return i; }))
004:    .rangeRoundBands([0, chartW], .1);
005:
006:var y1 = d3.scale.linear()
007:    .domain([0, d3.max(_data, function(d, i) { return d; })])
008:    .range([chartH, 0]);
009:
010:var xAxis = d3.svg.axis()
011:    .scale(x1)
012:    .orient('bottom');
013:
014:var yAxis = d3.svg.axis()
015:    .scale(y1)
016:    .orient('left');
017:
018:// Define the width of each bar.
019:var barW = chartW / _data.length;
Next the code creates the <g> elements, and glues them together into the structure we described above:
001:// Append the main 'svg' element if it doesn't exist for this instance of the module.
002:// Apppend the main 'g' elements.
003:// The 'classed' attributes define the CSS class.
004:if (!svg) {
005:    svg = d3.select(this)
006:        .append('svg')
007:        .classed('chart', true);
008:    var container = svg.append('g').classed('container-group', true);
009:    container.append('g').classed('chart-group', true);
010:    container.append('g').classed('x-axis-group axis', true);
011:    container.append('g').classed('y-axis-group axis', true);
012:}
Move the main <svg> element and x and y axis into place.
001:// Transform the main 'svg' and axes into place.
002:svg.transition().attr({width: width, height: height});
003:svg.select('.container-group')
004:    .attr({transform: 'translate(' + margin.left + ',' + margin.top + ')'});
005:
006:svg.select('.x-axis-group.axis')
007:    .transition()
008:    .ease(ease)
009:    .attr({transform: 'translate(0,' + (chartH) + ')'})
010:    .call(xAxis);
011:
012:svg.select('.y-axis-group.axis')
013:    .transition()
014:    .ease(ease)
015:    .call(yAxis);
Calculate a couple of variables used to layout the bars. Note that these variables will change every time the "exports" code is called (provided of course the data actually changes).
001:// Couple of variables used to layout the individual bars.
002:var gapSize = x1.rangeBand() / 100 * gap;
003:var barW = x1.rangeBand() - gapSize;
Next up we move onto the enter, update & exit code of the module.
First, select all of the elements with the "bar" class. If there aren't any, create them (this is the classic D3 'enter' section of the code):
001:// Setup the enter, exit and update of the actual bars in the chart.
002:// Select the bars, and bind the data to the .bar elements.
003:var bars = svg.select('.chart-group')
004:    .selectAll('.bar')
005:    .data(_data);
006:// If there aren't any bars create them
007:bars.enter().append('rect')
008:     .classed('bar', true)
009:     .attr({x: chartW,
010:         width: barW,
011:         y: function(d, i) { return y1(d); },
012:         height: function(d, i) { return chartH - y1(d); }
013:     })
014:     .on('mouseover', dispatch.customHover);
If there are updates, apply them using a transition (the 'update'):
001:// If updates required, update using a transition.
002:bars.transition()
003:    .ease(ease)
004:    .attr({
005:        width: barW,
006:        x: function(d, i) { return x1(i) + gapSize / 2; },
007:        y: function(d, i) { return y1(d); },
008:        height: function(d, i) { return chartH - y1(d); }
009:    });
Finally, if exits need to happen, apply a transition and remove the DOM nodes when the transition has finished (the 'exit'):
001:// If exiting, i.e. deleting, fade using a transition and remove.
002:bars.exit().transition().style({opacity: 0}).remove();
A series of getter/setter functions enhances the plugin API:
001:// Getter/setter functions
002:exports.width = function(_x) {
003:    if (!arguments.length) return width;
004:    width = parseInt(_x);
005:    return this;
006:};
007:exports.height = function(_x) {
008:    if (!arguments.length) return height;
009:    height = parseInt(_x);
010:    return this;
011:};
012:exports.gap = function(_x) {
013:    if (!arguments.length) return gap;
014:    gap = _x;
015:    return this;
016:};
017:exports.ease = function(_x) {
018:    if (!arguments.length) return ease;
019:    ease = _x;
020:    return this;
021:};
Do the rebinding of the 'customHover' event:
001:// Rebind 'customHover' event to the "exports" function, so it's available "externally" under the typical "on" method:
002:d3.rebind(exports, dispatch, 'on');
003:return exports;
That's it for the definition of the module. Next, we look at actually creating an instance of a module.
First, create an instance of a bar chart. Neither data nor selection has yet been passed to the chart, so nothing will actually happen based upon this function call.
001:var chart = d3.custom.barChart();
The update() function is called every second and creates a random data set, selects the <body> element in the HTML, passes the "data" variable containing the random data and finally makes the chart actually do something (by passing it the selection which the data has been bound to).
001:function update() {
002:    var data = randomDataset();
003:    d3.select('#figure')
004:        .datum(data)
005:        .call(chart);
006:}
Here's the small helper function to generate a random set of data:
001:// Generate random sets of data.
002:function randomDataset() {
003:    return d3.range(~~(Math.random() * 50)).map(function(d, i) {
004:        return ~~(Math.random() * 1000);
005:    });
006:}
The double-tilde (~~) is a double NOT bitwise operator. It is used here as a generally faster substitute for Math.floor(). You can check jsperf.com for empirical benchmark test results, or create your own: this particular issue has been tested extensively.
d3.range: Generates an array containing an arithmetic progression, so d3.range(~~(Math.random() * 50)) generates an array of numbers starting at zero, and ending at a random number between 0 and 50, e.g. [0,1,2,3,4,5, ...., 35]. It's basically a quick way of generating an array of between 0 and 50 numbers.
001:.map(function(d, i) {
002:    return ~~(Math.random() * 1000);
003:});
The above fills each entry in the array with a random value between 0 and 1000.
The code below makes an initial call to update to kick things off, and then periodically (every second) calls the update function:
001:// Call the update function to actually provide data to the charts and render the data.
002:update();
003:
004:// Call the update function once per second.
005:setInterval(update, 1000);
Creating Multiple Instances
The above is a walk-through of a barchart module/plugin, which is very handy when you need to create an instance of a barchart. We can quickly illustrate just how re-usable this code actually is.
You can amend the above code by changing the following:
001:var chart = d3.custom.barChart();
002:var chart2 = d3.custom.barChart();
003:
004:function update() {
005:    var data = randomDataset();
006:    d3.select('body')
007:        .datum(data)
008:        .call(chart);
009:
010:    var data2 = randomDataset();
011:    d3.select('body')
012:        .datum(data2)
013:        .call(chart2);
014:}
You now have two independent instances of the bar-chart, each with their own data, all on the same page, with no spaghetti code.
Flexibility in Creating Plugins
To whet your appetite for more, we have included two more examples of reusable bar chart plugins:
-
Remember the bar chart we created in chapter 1 ("Standard D3")? The spitting image of that one, turned into a reusable plugin, is available in
code/Chapter04/ResuableBarChart/. (The bar chart plugin we discussed above is a rather enhanced version of that one!) -
A further enhanced version of the reusable chart plugin discussed above is available in
code/Chapter04/ResuableBarChartWithTransitions: this one includes animation support for all parameters.
Also note this bit of code in that last example (code/Chapter04/ResuableBarChartWithTransitions/):
001:// Trick to just append the svg skeleton once
002:var svg = d3.select(this)
003:    .selectAll("svg")
004:    .data([_data]);
005:svg.enter().append("svg")
006:    .classed("chart", true);
Contrast that with this bit, since it is used in the bar chart plugin discussed above:
001:// Append the main 'svg' element if it doesn't exist for this instance of the module.
002:// Apppend the main 'g' elements.
003:// The 'classed' attributes define the CSS class.
004:if (!svg) {
005:    svg = d3.select(this)
006:        .append('svg')
007:        .classed('chart', true);
The former way is a smart way to solve the problem where we know animatable reusable charts will be called many times in the web page's lifetime without the need to store the original "svg" d3.selection in the closure.
The code snippet .data([_data]) turns our entire data array into a single data entry for that specific d3.selection, which is exactly what we want. We only wish to create a single <svg> node, plus we will be able to easily access the _data array itself in the enter/update/exit logic, since the _data array is now the value 'd' in those callbacks as shown here:
001:// Enter, Update, Exit on bars
002:var bars = svg.selectAll(".bar")
003:    .data(function(d, i) { return d; /* d === _data */ });
The remainder of the code in the 03.reusable-chart-with-transition-support.html is a simple expansion on the bar chart plugin code shown in this chapter, only extended with animation (d3.transition) support.
Summary
This chapter more fully fleshes out how to use the reusable API to construct reusable charts. In the next chapter we move onto discussing how to use test suites to fully test the plugins, modules, and components that we create.