Developing a D3.js Edge sample chapter
This book is aimed at both intermediate and advanced D3.js developers, particularly those interested in understanding the key modular design patterns at the heart of D3.js, and those wishing to know how to apply them to their own projects.
What is D3?
D3 is a visualization toolkit that Mike Bostock, author of Protovis (http://mbostock.github.com/protovis/), created along with Heer & Ogievetsky. D3.js emerged from Mike's previous work while part of Stanford University's Stanford Visualization Group.
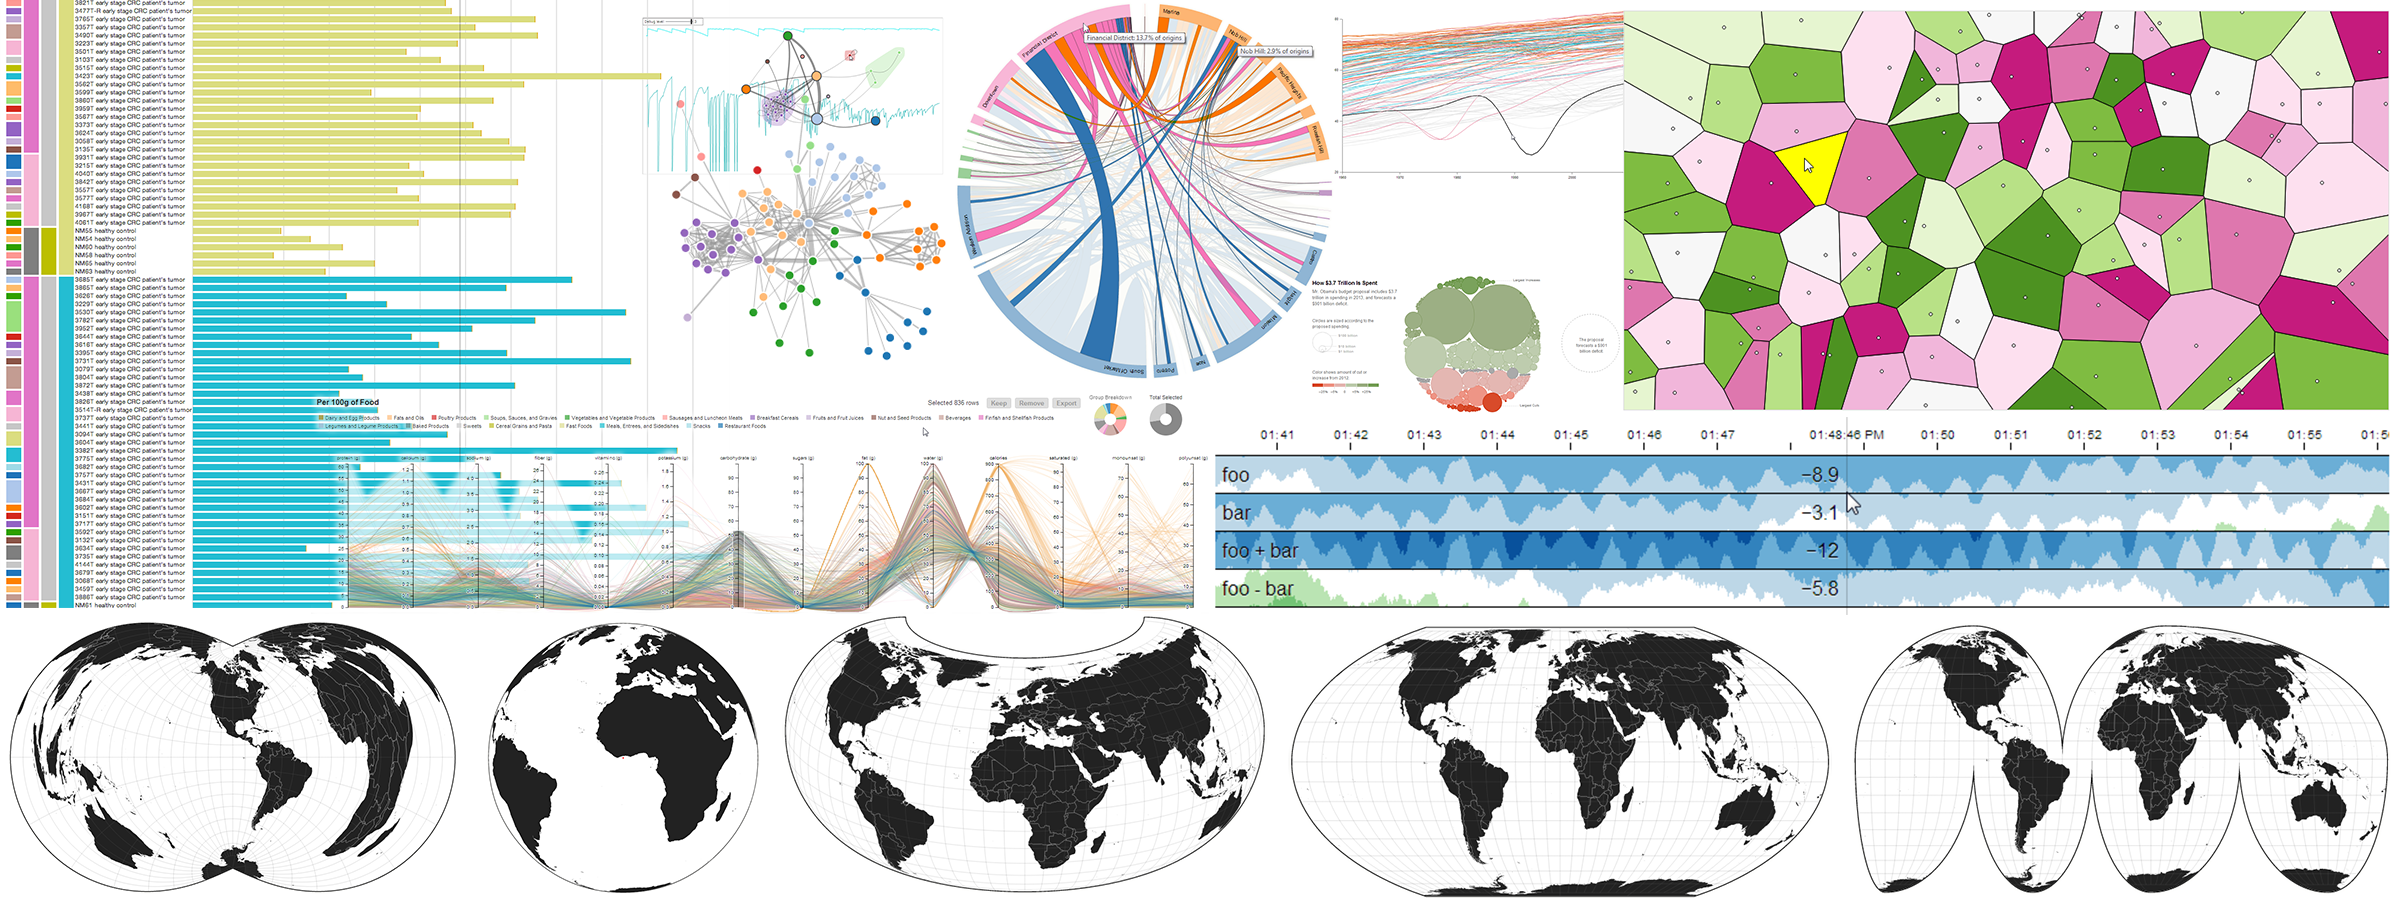
D3.js quickly gathered fame due to its very readable coding patterns and ease of use, combined with an unprecedented flexibility and adaptability. This allows developers of all backgrounds to create both static and animated visualizations of data sets ranging from the basic to the impressively complex:
Why should you use D3.js?
There are many reasons for using D3.js:
- It has been architected to facilitate both simple and flexible custom data displays in web pages.
- At its heart, D3.js enables a simple yet powerful mechanism whereby developers can associate data with ('bind data' to) a visual representation of that data (e.g. a chart). This association, however, allows for a significant degree of separation of code.
- D3.js does not restrict you to a limited set of configuration options that other easier visualization libraries offer with their charts.
- D3.js is tailored to facilitate visualization animation. You can plot a simple static graph just as easily, but when you want to visually mutate/transform that graph, nothing compares to using D3.js.
- D3.js is a library backed by a large community with a wide range of interests. The core team is small, but there's significant activity in the community. Consequently, when you are stuck, chances are high you'll receive help getting unstuck quickly and thoroughly.
![]() Charting libraries built with D3.js, such as NVD3, xChart, Dc.js, Rickshaw and DexCharts, provide excellent wrappers around the default charts in D3, which is very useful when you need to quickly put together a standard chart. For example, NVD3 successfully uses the same reusable pattern we demonstrate throughout this book.
Charting libraries built with D3.js, such as NVD3, xChart, Dc.js, Rickshaw and DexCharts, provide excellent wrappers around the default charts in D3, which is very useful when you need to quickly put together a standard chart. For example, NVD3 successfully uses the same reusable pattern we demonstrate throughout this book.
How Does this Book Help?
If you came across the title of this book and decided to read this introduction, more than likely you have some experience with D3.js (if not, head over to d3js.org to learn more). Perhaps you have studied one of the many examples online and you've adapted it to fit your specific needs. You have copied and pasted the code into your favorite text editor, changed the underlying dataset, and tweaked a few variables here and there until you found what you needed. For the most part, this works great. With all the outstanding examples provided by Mike Bostock and the enthusiastic D3.js community, chances are, what you want to visualize has probably been done before, and with some minor modifications, you can get it to work for you as well.
Maybe you developed your own visualization from scratch because you couldn't find exactly what you wanted. Starting from a clean slate, you began coding up your visualizations, figuring it out as you went along, likely ending up with something that resembles spaghetti code. Powering through, you got the visualization exactly the way you wanted and proudly published it for the world to see. And as the world is never one to be shy, somebody spoke up to say, “This visualization would be even better if you would simply change this tiny detail!” You then promptly replied, “You know what, you’re right! Now just let me figure out where I set that in this mess I call code!” Or better yet, perhaps the world is so in love with your visualization that they want to use it too, tweaking it slightly to fit their needs. Now they get the pleasure of diving into your many layers of code to adapt it for their use, surely cursing you along the way. And finally, after the glory surrounding your visualization has faded and you have moved on to new projects, you realize that with some minor modifications, your current project could use that visualization and you won’t need to duplicate all that work! So you proudly pull it off the shelf, blow the dust off of it and dive into your many layers of code, surely cursing yourself along the way.
This scenario is rather common, and certainly one that all of the authors of this book have experienced first hand. Fortunately, it is one that can easily be avoided. Having to relearn your own code every time you need to make a modification, or when you want to reuse it is both inefficient and unnecessary. Mike Bostock introduced a reusable pattern to avoid exactly these scenarios, and it is this pattern that we will expand on in this book.
How Was this Book Produced?
The book was created through a mini virtual "book sprint". From booksprints.net:
A Book Sprint brings together a group to produce a book in 3-5 days. There is no pre-production and the group is guided by a facilitator from zero to published book. The books produced are high quality content.
You can purchase the complete book here.
What Do You Need to Know?
To get the most out of this book you need to have at least some experience in JavaScript and with creating graphics using D3.js. It is also handy to have a good working relationship with your debugger (Chrome Developer panel or the Firefox/Firebug combo). Although we do not address those tools directly in this book, we believe that stepping through the examples provided with this book will enhance your understanding of the concepts explained and showcased here. We assume that you're somewhat comfortable with any and all of these concepts:
- Using D3.js
- Functions as first-class citizens
- Closures
- Some general terminology (methods, object properties, private vs. public, function chaining, etc.)
Source Code: Availability & Organization
All the source code referred to in this book is available at github: https://github.com/backstopmedia/D3Edge
You can either download the latest version of all the files in a ZIP archive at the URL below or use git to fetch the repository: https://github.com/backstopmedia/D3Edge/archive/master.zip.
The source files are organized as follows:
- Unless otherwise noted in the chapters themselves, the sources for each chapter are stored in the
code/<chapter>directory, where<chapter>denotes the chapter number and title, e.g. code/Chapter01/ - Files that are shared by many reside in another part of the directory hierarchy:
- JavaScript libraries such as D3.js are located in the
lib/directory tree - Data files are stored in the
data/directory tree
- JavaScript libraries such as D3.js are located in the
The Authors
Chris Viau is a PhD in Computer Engineering from Ecole de Technologie Superieure in Montreal, specialized in Information Visualization. He lives between San Francisco and Montreal, working on visual analytics for BigData. You can easily find him on the D3 Google Groups, follow his D3 Twitter feed @d3visualization, or meet him at the Bay Area D3 User Group.
Andrew Thornton is our Austin, TX, USA based data specialist and one of the code artists responsible for the D3.js application demo software and a couple of utilities to make our work with this bleeding edge way of producing technology books through BookType the best possible experience. Andrew has, next to handling the nasty job of wading through the raw data muck that we call data sources, contributed the flesh and bone (and quite a bit of skin as well) of the core of our book. He can be found on Twitter, @graftdata, in the D3 Google Groups, and as the leader of the Austin d3.js Meetup group.
Roland Dunn is a data viz and optimization consultant based in London, UK with over a decade of working in digital media. Roland has contributed to a number of chapters in the book, while also helping keep the team on a clear and (hopefully) coherent narrative. Roland is a partner at http://www.refinedpractice.com/, has his own experimental site at http://www.cloudshapes.co.uk/ (which includes a couple of examples following some of the techniques described in this book), is on Twitter at http://twitter.com/roland_dunn/, and can sometimes be found at the London D3 Meetup.
Ger Hobbelt, Dutch national and citizen of political centre The Hague has over two decades of professional IT experience, ranging from 'hard real-time' embedded development all the way to mission-critical financial data processing application development and data visualization. His specialties are risk analysis and modeling / architecture. Thanks to his personal makeup and love for all things fundamental, he never stopped to ask 'why?' As a former trainer for fundamental process and organization analysis, it was rather obvious he be assigned the task to write the bits addressing the theoretical and conceptual fundaments underpinning solid D3 software development, and maybe a few twiddled bits here and there.
Troy Mott is the publisher (bleedingedgepress.com)of this book and contributor through providing most of the infrastructure required to facilitate a global team of authors and developers in producing this technology book.
Next Chapter
In the next chapter, we dive into the standard approaches to using D3.js, how D3.js lends itself to re-usability, and some of the issues that you can encounter when pushing these approaches to the limits.