Developing a D3.js Edge
8. Map API
- Visualize our data in a map
- Produce a map for all three cities
- Plot the routes and stops for each city
As outlined in our API's requirements, we want to visualize our data in a map, and in a radial histogram that aggregates a metric of our choosing. We will first take a look at producing the API for the map module. For our reusable map module, we obviously want to use it to produce a map for each individual city, and plot the routes and stops for each city.
To accomplish this, the module must be able to accept varying data sets, be centered on the city's coordinates, scaled to appropriately display the data points, have zoom capability, and be sized to customize our needs. In addition, later on we want to add some brushing, which will allow us to link the two graphics together for each city.
Drawing Routes
![]() Source code and data files are available in the
Source code and data files are available in the code/Chapter08/DrawingRoutes/ directory tree.
To begin with, we will define our map module:
001:d3Edge.map = function module() {
002:    // Create our custom events, and variables.
003:    var dispatch = d3.dispatch('hover', 'drawEnd', 'brushing'),
004:        projection,
005:        path,
006:        t,
007:        s,
008:        svg,
009:        center,
010:        scale,
011:        size,
012:        brush;
013:    // Create and exports function that can be invoked on a selection.
014:    function exports(_selection) {
015:    }
016:    // Bind our custom events to the 'on' method of our function.
017:    d3.rebind(exports, dispatch, 'on');
018:    return exports;
019:};
You may have noticed that in this module, we return a function rather than an object, like we did in our data manager module.
In the data manager module, exports was defined as an object:
001:var exports = {},
In all of the earlier examples in this book, exports is defined as a function:
001:function exports(....) {
We take the approach here (i.e. returning a function and not an object), because this module will be invoked on a D3.js selection. This will allow us to perform standard D3.js DOM manipulation and data binding, thus actually creating our visualization.
Now that we have our module's skeleton code defined, we can begin implementing our methods. First off, as we mentioned above, we need to be able to center, scale, and size each map. To set these parameters, we will create a method for each map that will serve as both a getter and a setter. Each method accepts an argument. If the argument is supplied, the parameter is updated with the value of the argument (setter). If the argument is not supplied, the current value of the parameter is returned (getter):
001:// Create a center method to serve as both a getter, and a setter.
002:exports.center = function(_x) {
003:    if (!arguments.length)
004:        return center;
005:    center = _x;
006:    return this;
007:};
008:// Create a scale method to serve as both a getter, and a setter.
009:exports.scale = function(_x) {
010:    if (!arguments.length)
011:        return scale;
012:    scale = _x;
013:    return this;
014:};
015:// Create a size method to serve as both a getter and setter.
016:exports.size = function(_x) {
017:    if (!arguments.length)
018:        return size;
019:    size = _x;
020:    return this;
021:};
By returning this when updating a parameter, we allow ourselves to easily chain these methods together for succinct code. This makes instantiating each instance of our map module very simple. For example, a map for Zurich could be instantiated, centered, scaled, and sized like so:
001:zurichMap = d3Edge.map()
002:.center([8.5390, 47.3687])
003:.scale(900000)
004:.size([width, height]);
This pattern should be very familiar to you since it is one D3.js uses very often. However, instantiating this won't produce much since we haven't defined any mapping yet! Our next step is to develop our exports function so that we can actually produce a visualization. Since we want this module to be used for generating both the routes and the stops, our export function will simply be used to access the svg element that calls our module, and to define our projection and path generating functions using d3.geo.mercator() and d3.geo.path():
001:// Create and exports function that can be invoked on a selection.
002:function exports(_selection) {
003:    // Set svg equal to the selection that invokes this module.
004:    svg = svg || _selection;
005:    // Bind an empty datum to the selection. Useful later for zooming.
006:    svg.datum([]);
007:    // Set the projection up using our scale, center, and size parameters.
008:    projection = projection || d3.geo.mercator()
009:    .scale(scale)
010:    .center(center)
011:    .translate([size[0]/2, size[1]/2]);
012:    // Set the path up using our projection defined above.
013:    path = path || d3.geo.path()
014:    .projection(projection);
015:}
The exports function above is simply grabbing onto the svg element that calls our module, and setting up our projections. If the projections are already defined, we will us them. If not, we have supplied defaults.
We can then call our module from a D3.js selection like so:
001:var width = 570,
002:    height = 500;
003:
004:var zurichMap = d3Edge.map()
005:.center([8.5390, 47.3687])
006:.scale(900000)
007:.size([width, height]);
008:
009:d3.select('#zurich_map')
010:.append('svg') .attr('width', width)
011:.attr('height', height)
012:.call(zurichMap);
At this point, our exports function has granted us access to the svg element that called our module and assigned it to a local variable, thus allowing us to apply standard D3.js methods to produce a visualization. We can now use the local variable, svg, throughout our module to append both our routes and our stops. Let us define a method that will display our routes:
001:// Create a drawRoutes method that can be invoked to create routes for each city.
002:exports.drawRoutes = function(_data) {
003:    svg.append('path')
004:    .attr('class', 'route')
005:    .datum(topojson.object(_data, _data.objects.routes))
006:    .attr('d', function(d, i) {
007:         return path(d, i);
008:    });
009:    // Dispatch our routesEnd event so we know with the routes visualization is complete.
010:    dispatch.routesEnd();
011:};
This method accepts a single argument--the geographic data to be mapped. It then appends a path to our local svg variable, using the path generator as defined in our exports function. If we invoke this method, we will finally start to see something on our screen! It is at this point we can combine our data manager module with our map module. Since the drawRoutes method needs geographic data as it's only argument, we can invoke it as the callback of our loadGeoJson method on our data manager module:
001:// Load the routes data and pass our drawRoutes method as the callback to be executed upon data load.
002:zurichDataManager.loadGeoJson('./data/zurich/routes_topo.json', zurichMap.drawRoutes);
Executing this code will produce the transit routes for Zurich as shown in the image below.
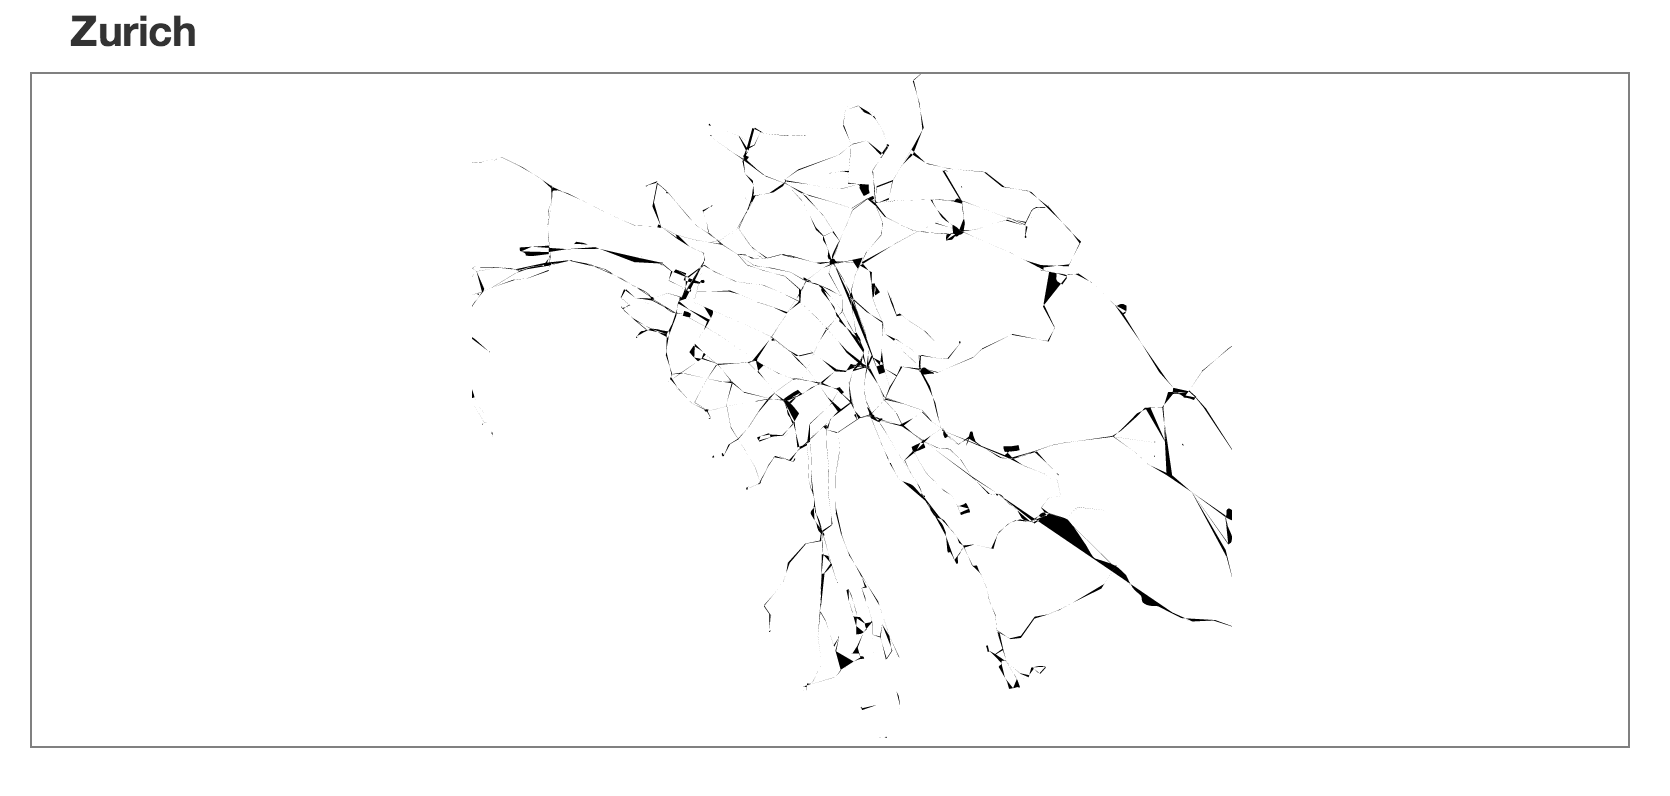
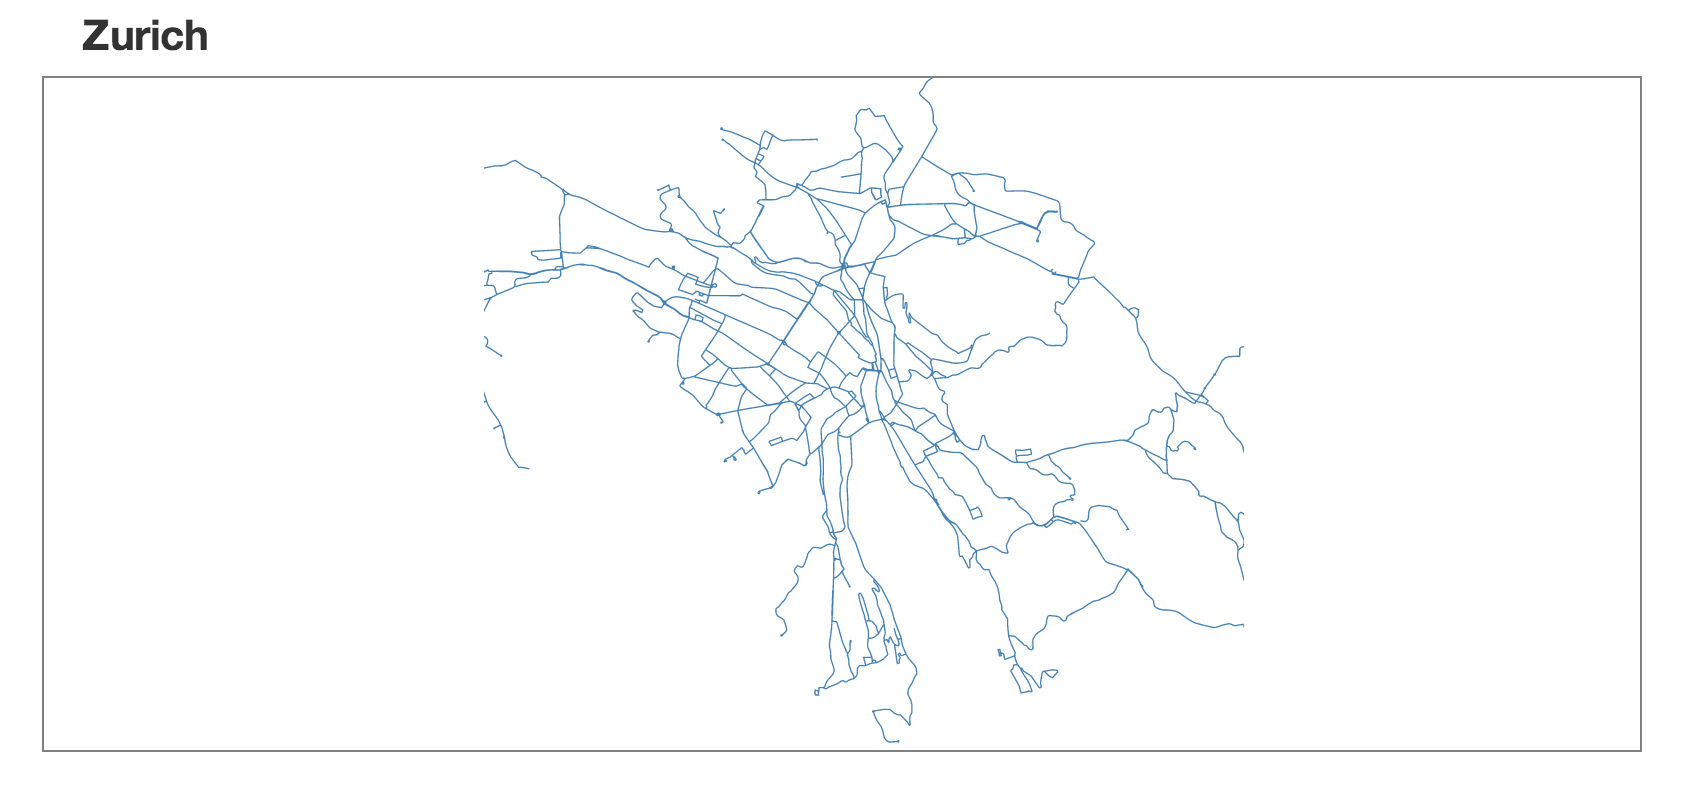
Applying a little bit of CSS (style sheets) produces something a little more appealing.
001:.route {
002:    stroke: #4682b4;
003:    fill: none;
004:}
Drawing Stops
![]() The source code and data files are available in the
The source code and data files are available in the code/Chapter08/DrawingStops/ directory tree.
We can create a similar method to visualize the stops. In this method, however, we want to add a custom event to allow us to interact with individual stops on mouseover:
001:// Create a drawStops method that can be invoked to create stops for each city.
002:exports.drawStops = function(_data) {
003:    svg.selectAll('.stop')
004:    .data(_data.features)
005:    .enter()
006:        .append('circle')
007:        .attr('cx', function (d) { return projection(d.geometry.coordinates)[0]; })
008:        .attr('cy', function (d) { return projection(d.geometry.coordinates)[1]; })
009:        .attr('r', 2)
010:        .attr('class', 'stop')
011:        .on('mouseover', dispatch.hover);
012:    // Dispatch our stopsEnd event so we know with the stops visualization is complete.
013:    dispatch.stopsEnd();
014:};
Just like the drawRoutes method, this method accepts a single argument, the data to be mapped. For each data point, it will plot a point at using the projection we defined in our exports function. In addition, this method we have added a custom event that will be fired when we mouseover a circle. The definition of how to handle this event can then be defined when we instantiate our mapping module for each instance of the chart.
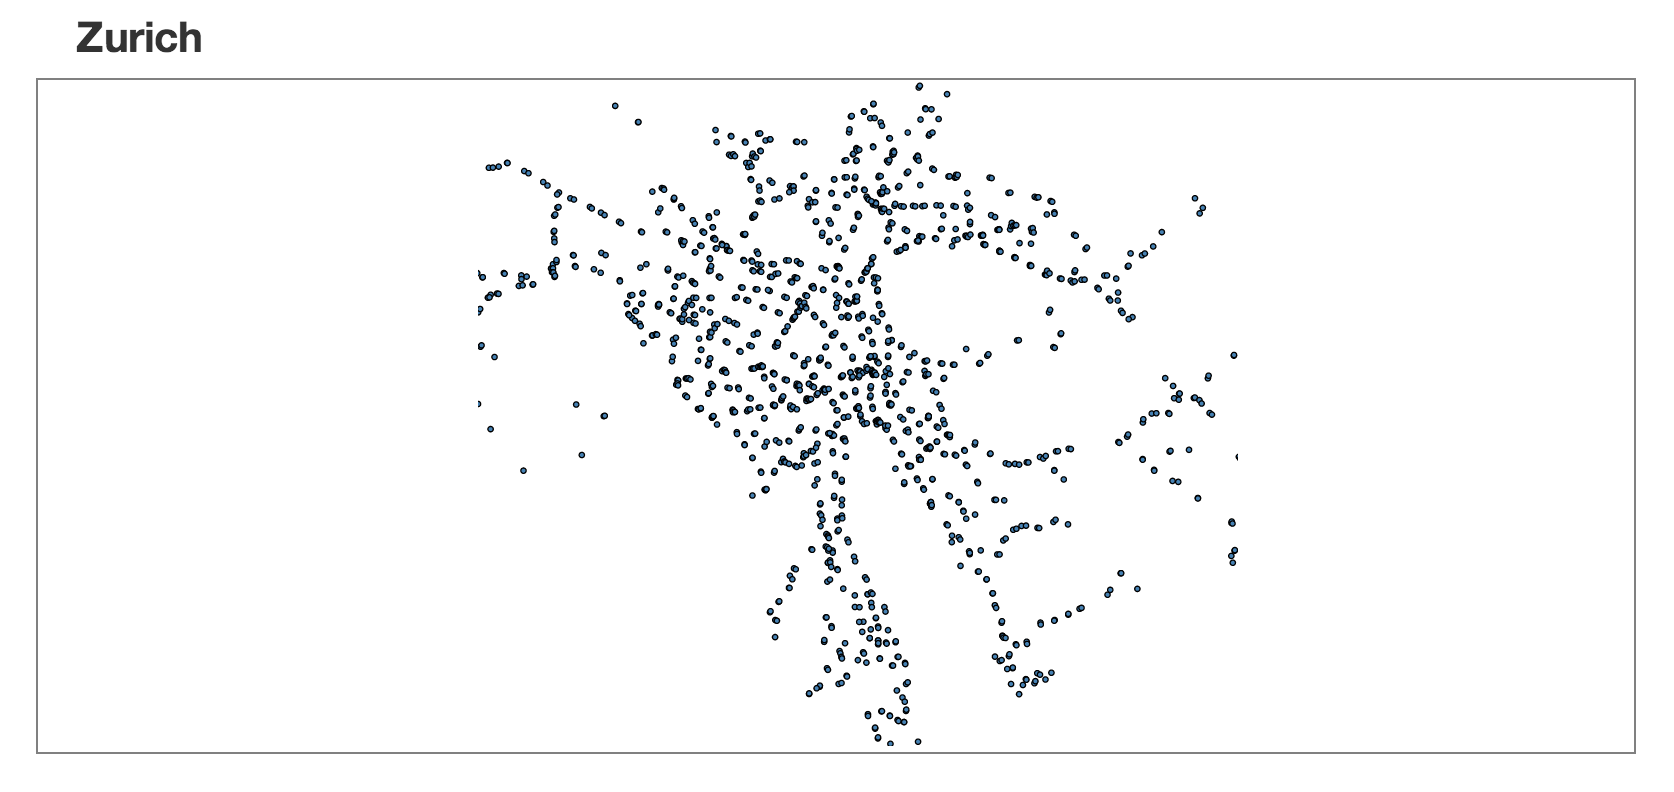
Executing this code will produce the transit stops for Zurich as shown here:
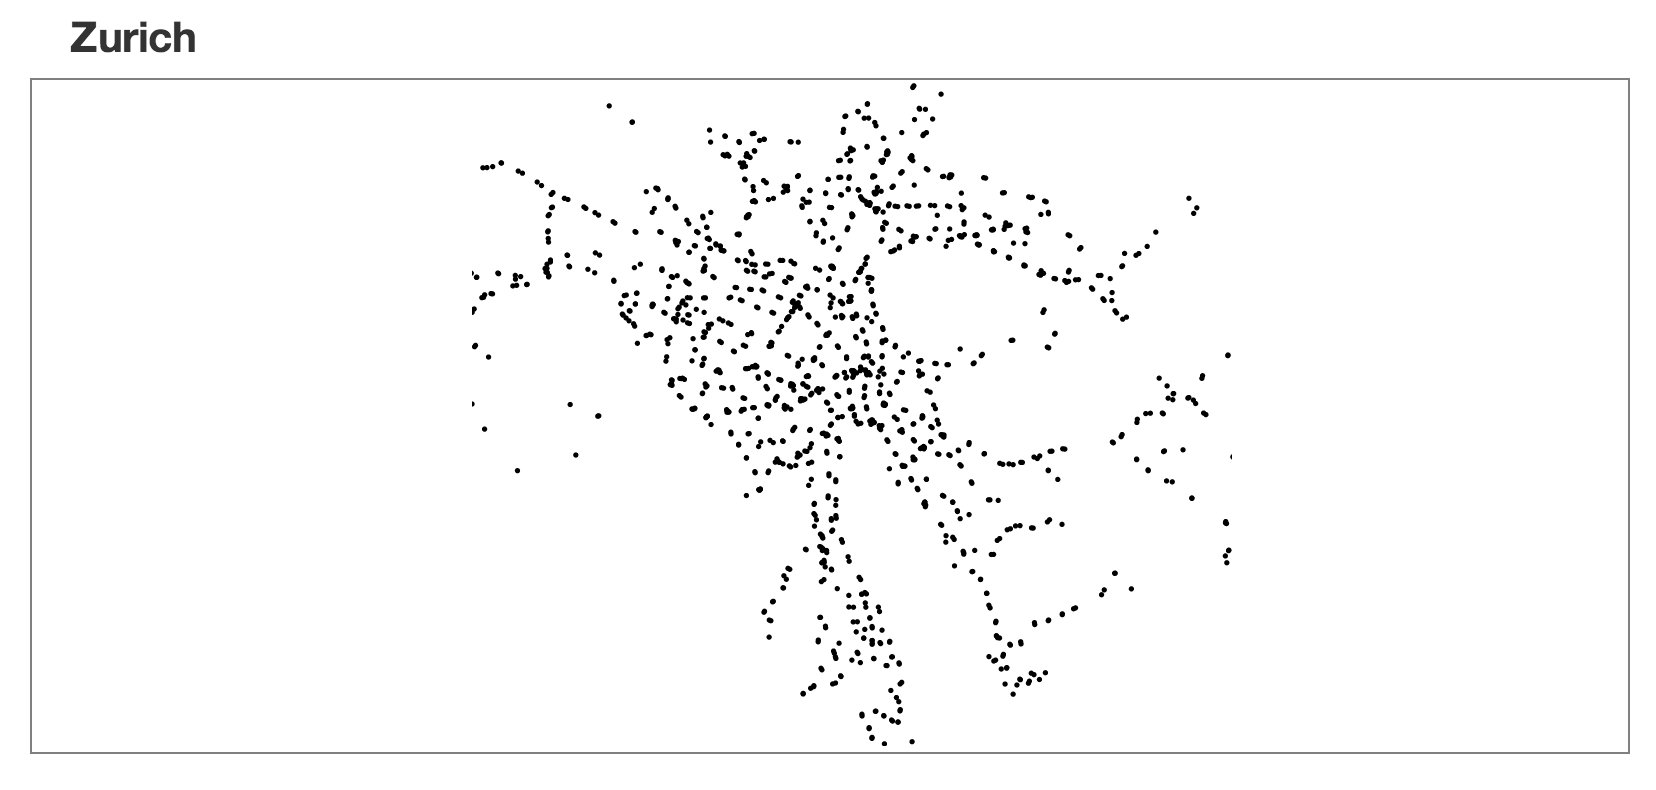
Again, we can apply a little CSS to make things a little more appealing.
001:.stop {
002:    fill: #4682b4;
003:    stroke: #000;
004:    cursor: pointer;
005:}
Draw Route and Stops
![]() The source code and data files are available in the
The source code and data files are available in the code/Chapter08/DrawRoutesAndStops/ directory tree.
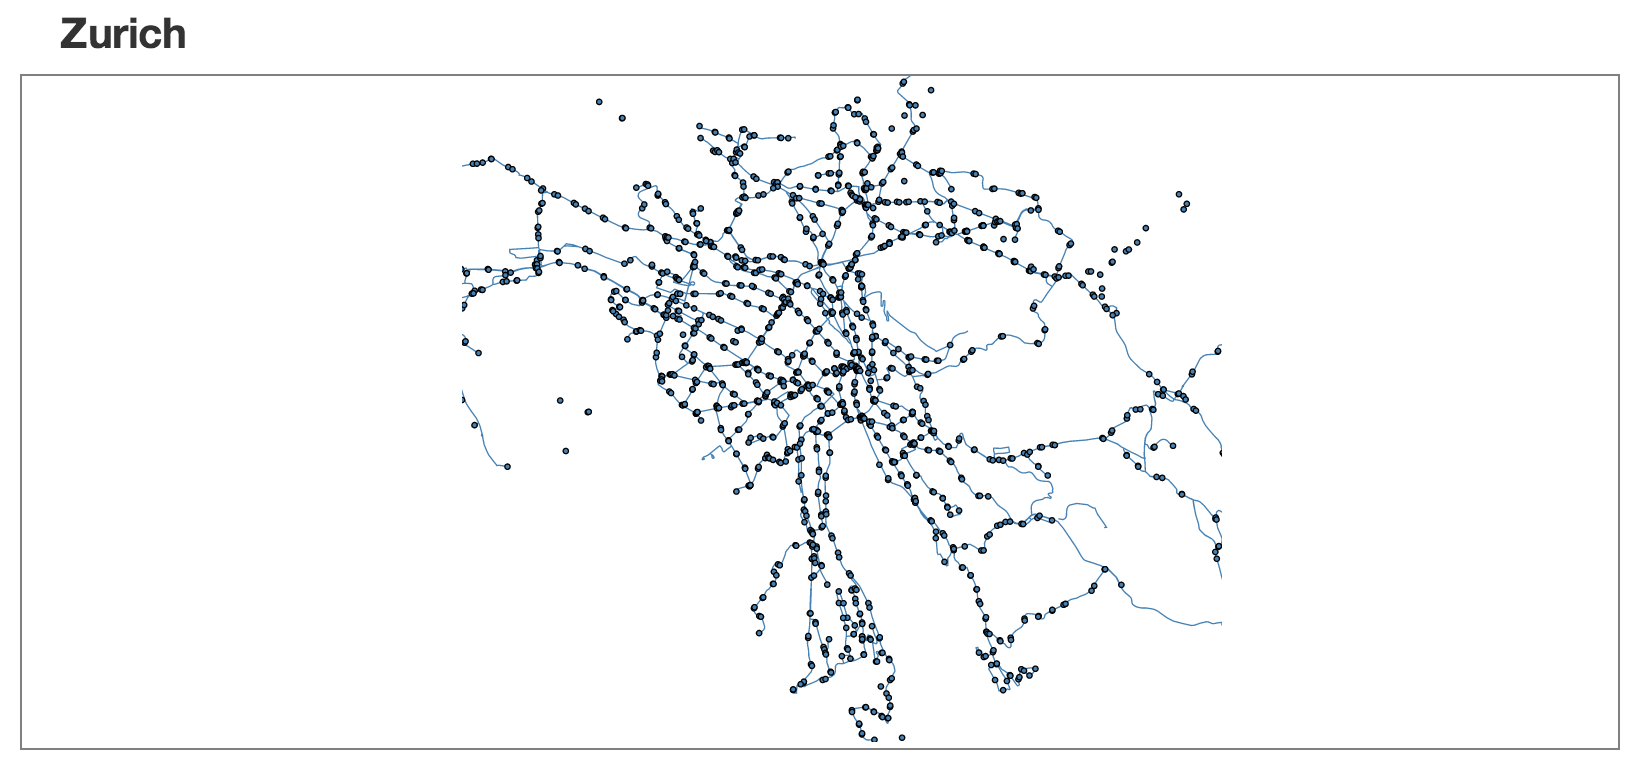
Finally, we can combine these two methods to create a complete map. We will use our custom routesEnd event to invoke our drawStops method after the routes have been rendered. This ensures that the stops appear on top of the routes:
001:// Load the routes data and pass our drawRoutes method as the callback to be executed once the data loads.
002:zurichDataManager.loadGeoJson('./data/zurich/routes_topo.json', zurichMap.drawRoutes);
003:// After the routes have been rendered, render the stops.
004:zurichMap.on('routesEnd', function () {
005:    // Load the stops data and pass our drawStops method as the callback to be executed once the data loads.
006:    zurichDataManager.loadGeoJson('./data/zurich/stops_geo.json', zurichMap.drawStops);
007:});
Combine The Maps
![]() Source code and data files are available in the
Source code and data files are available in the code/Chapter08/CombineTheMaps/ directory tree.
Now that our map module is producing something worth looking at, let's leverage the power of the module and create a map for each city. All we need to do is instantiate a data manager module and a map module for each city, and call the methods we outlined above:
001:// Define our width and height for our visualizations.
002:var width = 570,
003:height = 500;
004:// Instantiate our data manager module for each city.
005:var sanFranciscoDataManager = d3Edge.dataManager(),
006:    zurichDataManager = d3Edge.dataManager(),
007:    genevaDataManager = d3Edge.dataManager();
008:// Instantiate our map module for Zurich.
009:var zurichMap = d3Edge.map()
010:    .center([8.5390, 47.3687])
011:    .scale(900000)
012:    .size([width, height]);
013:// Instantiate our map module for Geneva.
014:var genevaMap = d3Edge.map()
015:    .center([6.14, 46.20])
016:    .scale(900000)
017:    .size([width, height]);
018:// Instantiate our map module for San Francisco.
019:var sanFranciscoMap = d3Edge.map()
020:    .center([-122.4376, 37.77])
021:    .scale(900000)
022:    .size([width, height]);
023:// Bind our modules to the DOM.
024:d3.select('#zurich_map')
025:.append('svg')
026:.attr('width', width)
027:.attr('height', height)
028:.call(zurichMap);
029:
030:d3.select('#geneva_map')
031:.append('svg')
032:.attr('width', width)
033:.attr('height', height)
034:.call(genevaMap);
035:
036:d3.select('#san_francisco_map')
037:.append('svg')
038:.attr('width', width)
039:.attr('height', height)
040:.call(sanFranciscoMap);
041:
042:// Load the routes data and pass our drawRoutes method as the callback to be executed once the data loads.
043:zurichDataManager.loadGeoJson('./data/zurich/routes_topo.json', zurichMap.drawRoutes);
044:// After the routes have been drawn, draw the stops.
045:zurichMap.on('routesEnd', function () {
046:    // Load the stops data and pass our drawStops method as the callback to be executed once the data loads.
047:    zurichDataManager.loadGeoJson('./data/zurich/stops_geo.json', zurichMap.drawStops);
048:});
049:
050:// Load the routes data and pass our drawRoutes method as the callback to be executed once the data loads.
051:genevaDataManager.loadGeoJson('./data/geneva/routes_topo.json', genevaMap.drawRoutes);
052:
053:// After the routes have been drawn, draw the stops.
054:genevaMap.on('routesEnd', function () {
055:    // Load the stops data and pass our drawStops method as the callback to be executed once the data loads.
056:    genevaDataManager.loadGeoJson('./data/geneva/stops_geo.json', genevaMap.drawStops);
057:});
058:
059:// Load the routes data and pass our drawRoutes method as the callback to be executed once the data loads.
060:sanFranciscoDataManager.loadGeoJson('./data/san_francisco/routes_topo.json', sanFranciscoMap.drawRoutes);
061:// After the routes have been drawn, draw the stops.
062:sanFranciscoMap.on('routesEnd', function () {
063:    // Load the stops data and pass our drawStops method as the callback to be executed once the data loads.
064:    sanFranciscoDataManager.loadGeoJson('./data/san_francisco/stops_geo.json', sanFranciscoMap.drawStops);
065:});
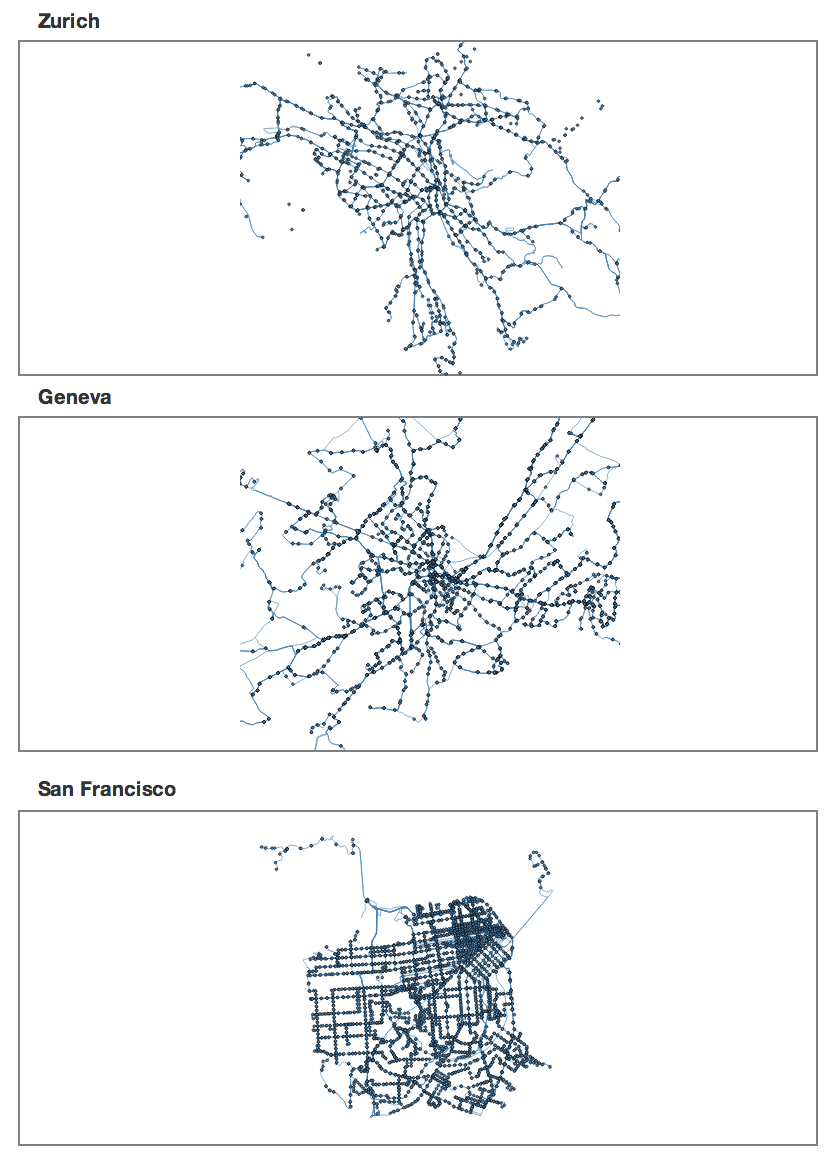
As you can see above, we have instantiated a data manager module, and a mapping module for each one of our cities. We then add an <svg> element for each city, and call the mapping module. As we know, this will grant us access to the <svg> element via our exports function, and allows us to render the routes and stops, once the data loads. Using our data manager module, once we see that we have loaded the data, we call our drawRoutes and drawStops methods, to render the charts.
This code should produce three nicely formatted maps as shown here:
Summary
Now that we have our basic data manager setup, and have produced a map for every city, we need to start making sense of the stop metrics that we have in our data sets. To do so, we are going to want to produce some aggregate statistics that are common among all cities so that we may compare them. With data sets as massive as ours, filtering, grouping, summing, and averaging the data can be a monumental tasks. Fortunately, there are some great libraries out there that make this task much easier for us. We can integrate these libraries into our own custom API to abstract the heavy lifting that these libraries do and make the interface with our module consistent with the rest of the application, as shown in the next chapter.